Dashboard
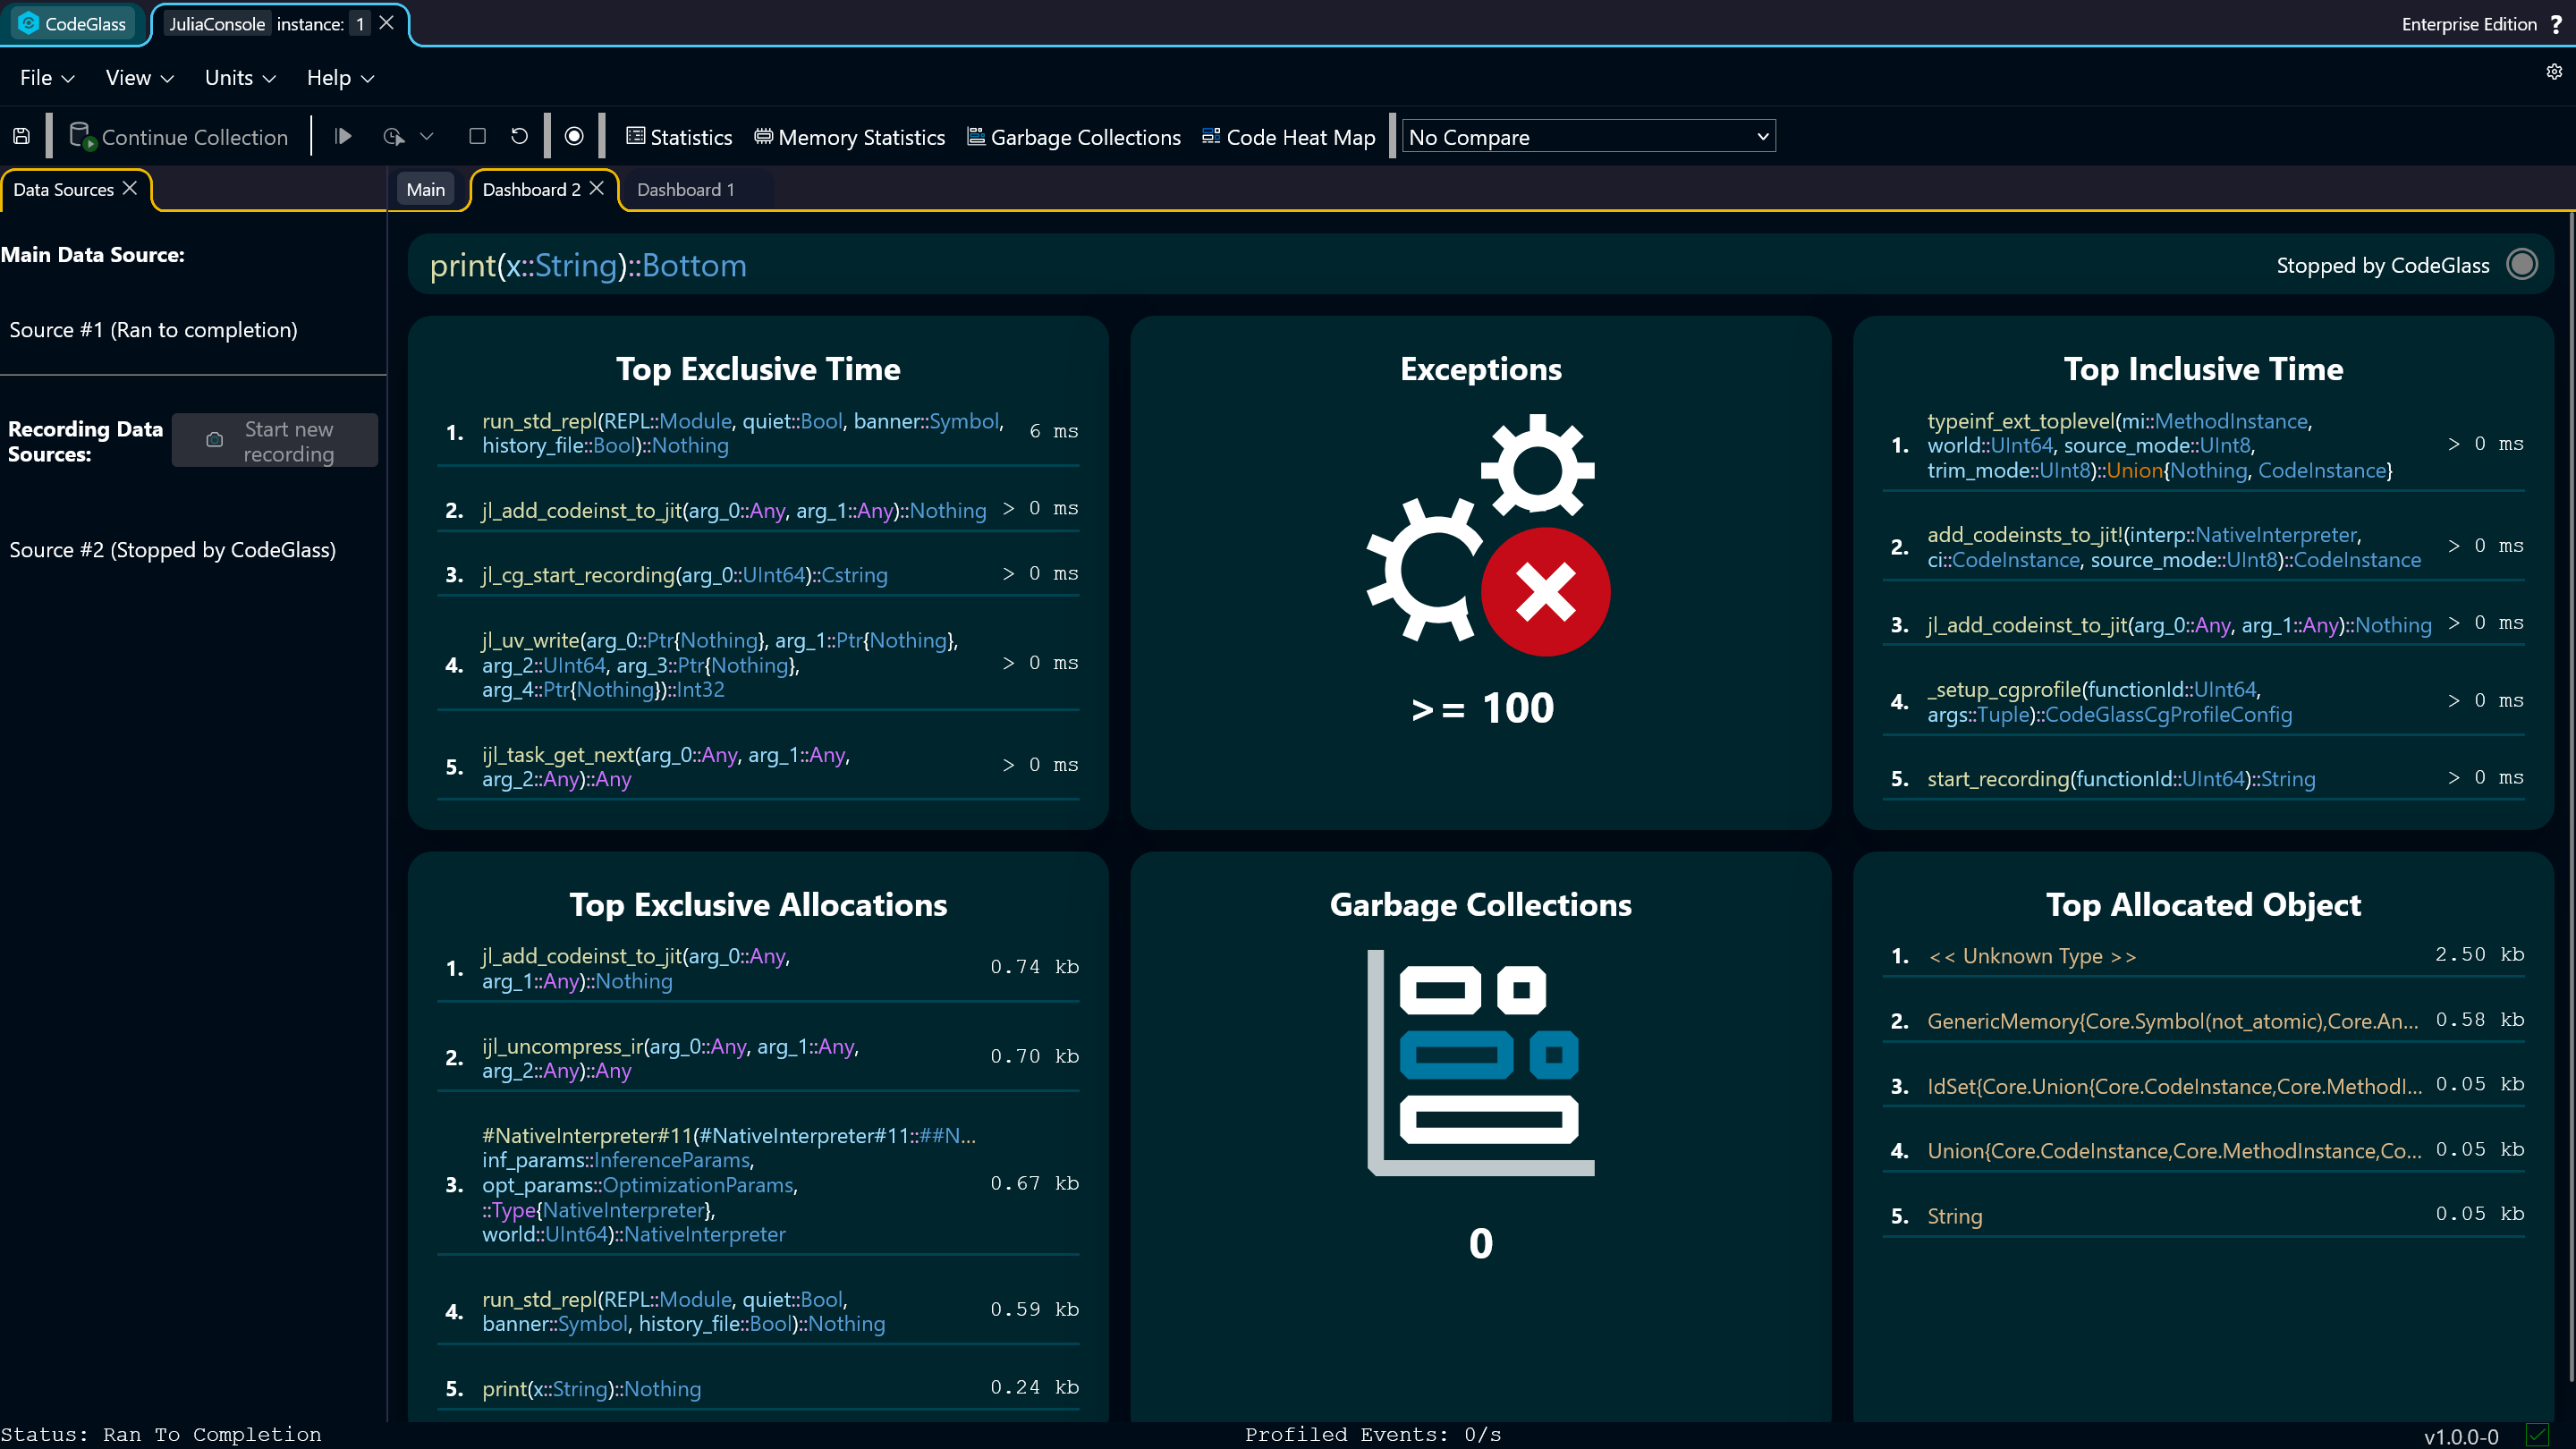
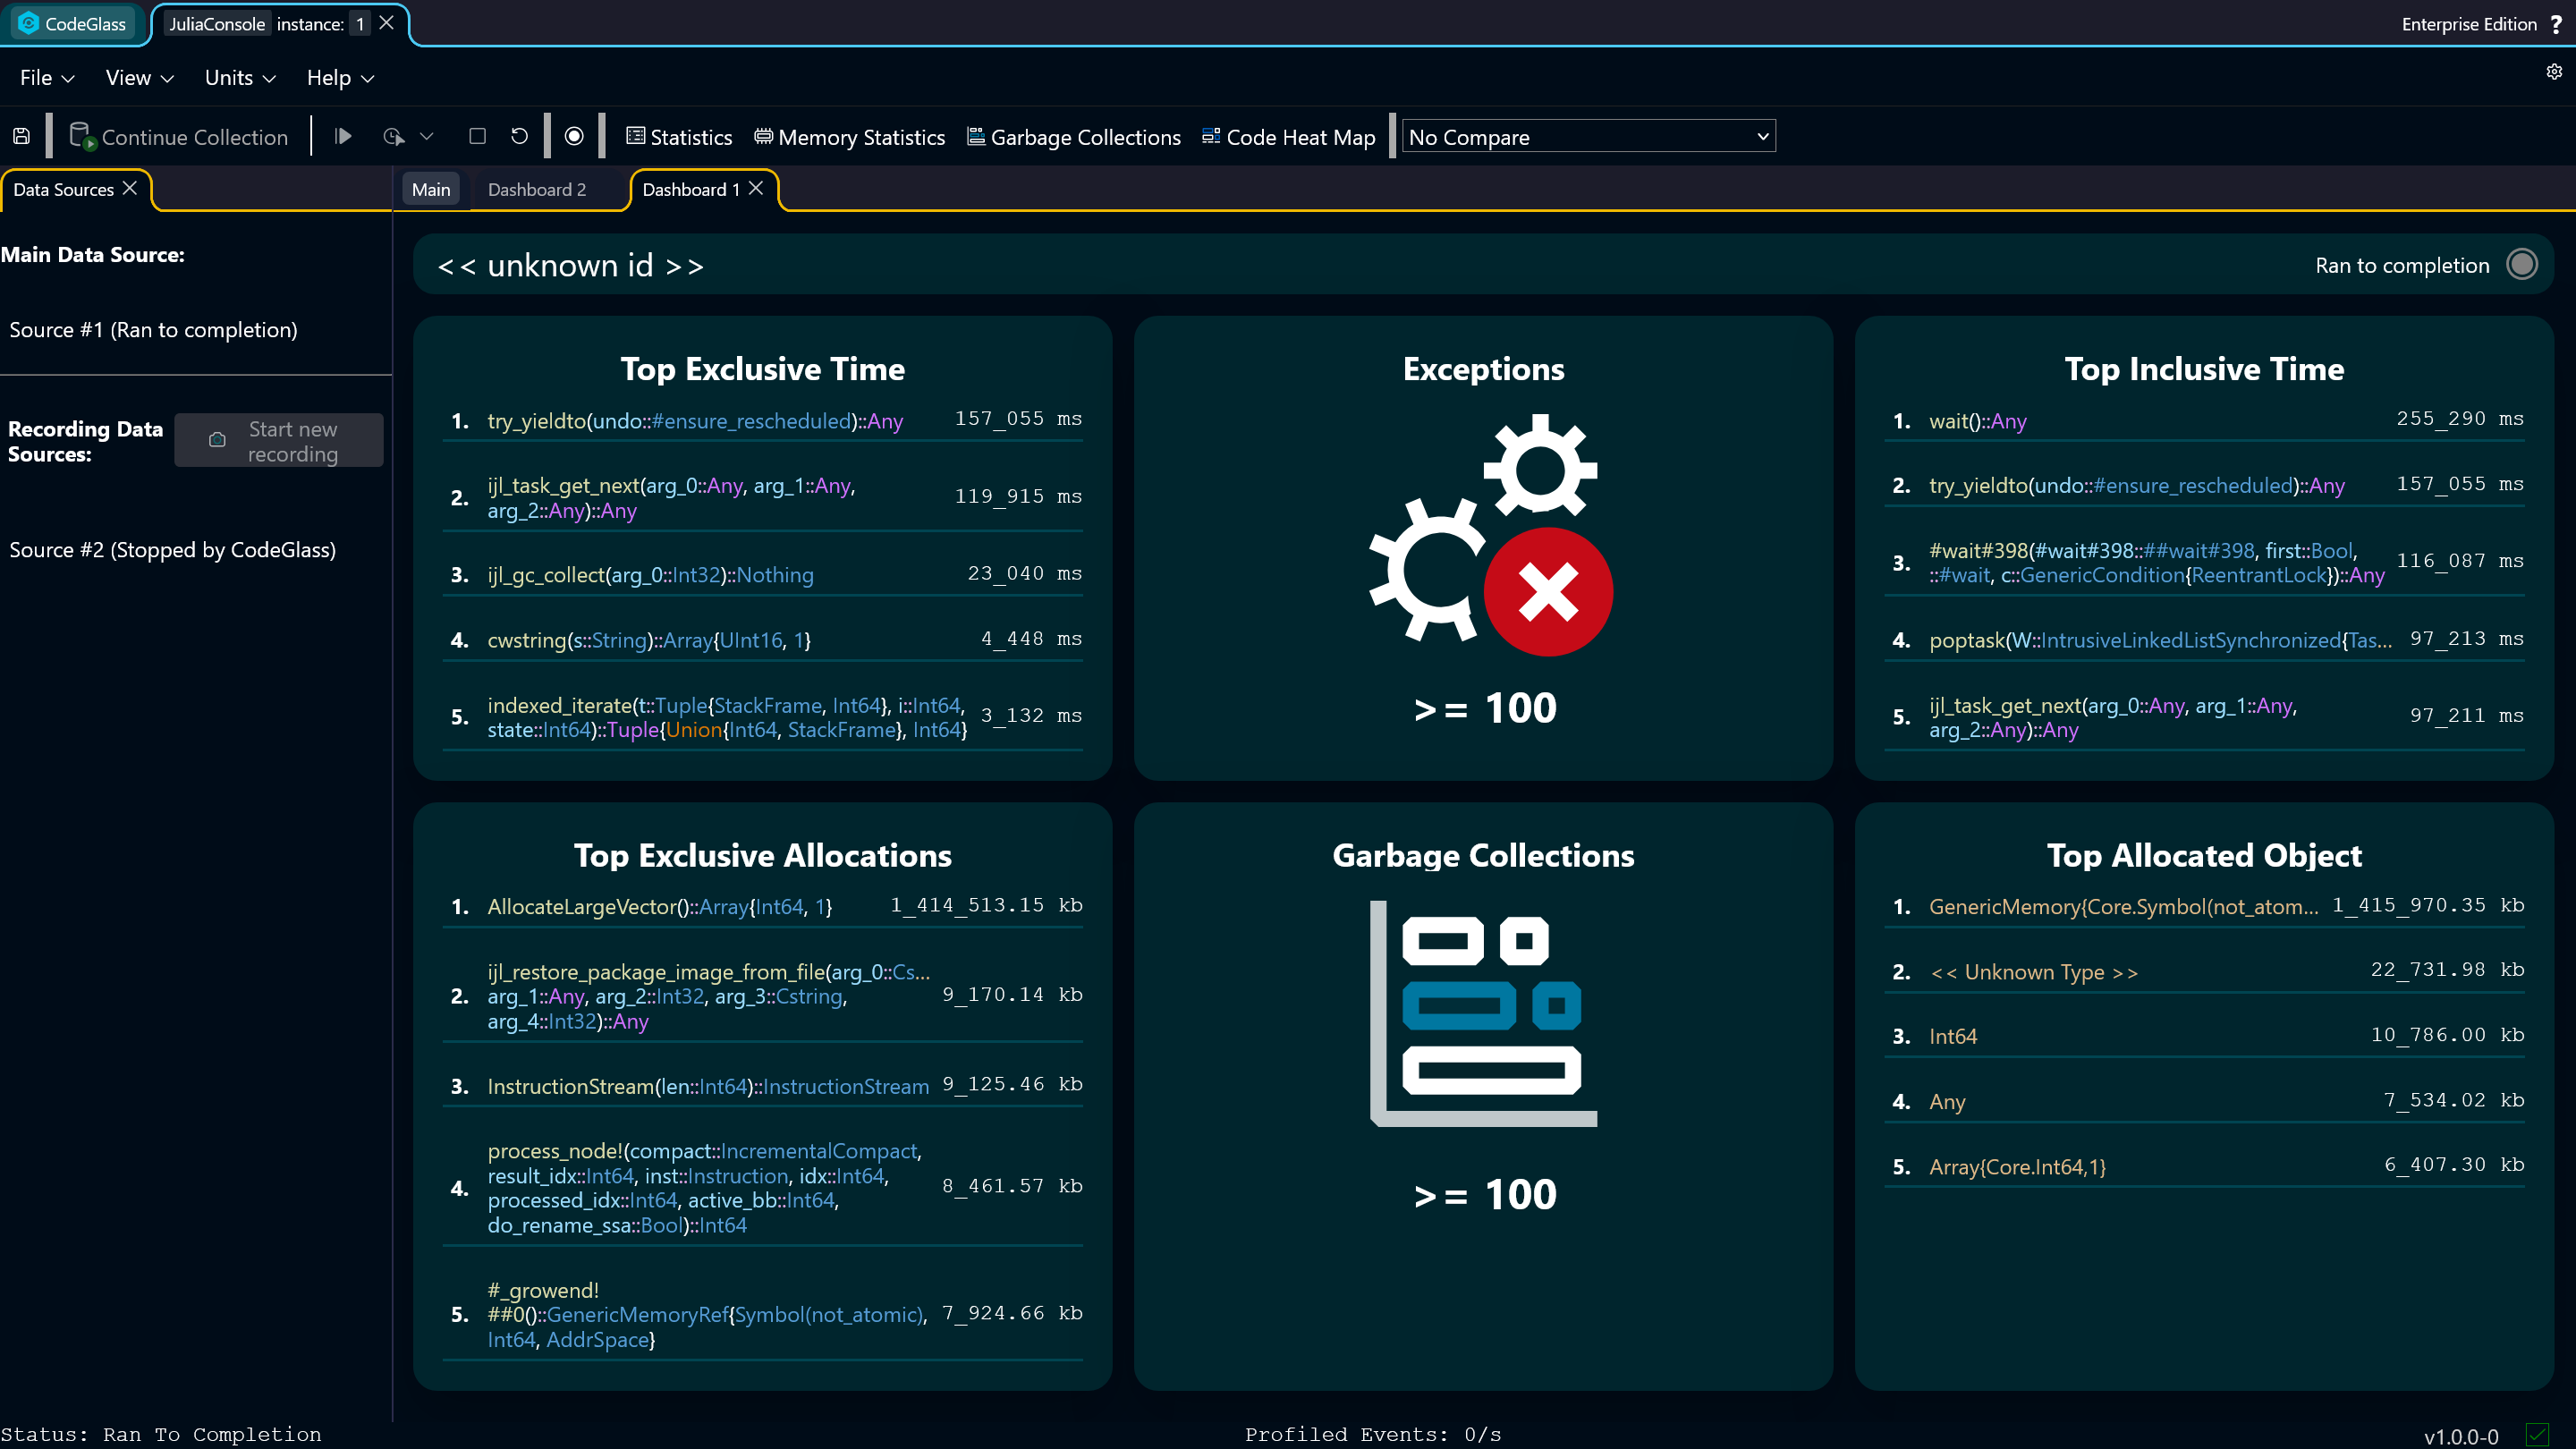
The Dashboard shows a quick overview of the most interesting data of a data source.
When creating recordings using the @cgview or @cgprofile macro, the name of the function that was profiled will be shown on top. For other data sources this will be shown as "<<unknown id>>". The status of the data source is shown on the top right.
warning
The entry function might show as not called in the code member view. This can happen due to inlining.
Statistics
The view is divided into time statistics at the top and memory statistics at the bottom.
Time
- Top Exclusive Time: Code members sorted by the time spent in their own code. This is used for finding the code members that actually take up CPU time.
- Exceptions: The number of exceptions that occurred.
- Top Inclusive Time: Code members sorted by the time spent in their own code and the code members it calls. This is used for finding entry points for heavy execution paths. If the data source contains an entry or main code member, this will often show up on top of this list.
Memory
- Top Exclusive Allocations: Code members sorted by how much memory was allocated in their own code. This is used for finding the code members that actually allocate the most memory.
- Garbage Collections: How many garbage collections occurred. Many garbage collections can point to high GC pressure due to many allocations, and contribute to longer execution times.
- Top Allocated Object: Objects sorted by how much memory was allocated for them. This is used to reveal what types contributed most to memory pressure.
note
These statistics were selected as they often contain the most interesting profiling data. Your use case might differ, so reach out to us if you are missing some statistic here.